

On Humans And Our Love of Data
Humans have been enamoured with data for over at least 20,000 years. It's just part of who we are. Here I look at data. How we got to now and where we may be going.

Our brains love patterns. They help us make sense of the world, define our realities and understand where we are. Mathematics is a language, eloquent and as valuable and informative to us as words, written and spoken. We use math and language to tell stories and stories become narratives which becomes our realities.
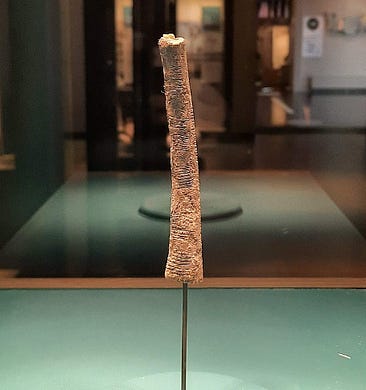
All of this driven by data. Patterns. Equations. The creation of data has been a fundamental aspect of human societies going back, as far as we currently know about 19,000 years to what is sometimes called The Great Baboon. It was, it is thought, a calculating tool made of a baboon bone called the Ishango bone. It was very popular because you could easily carry it around, no batteries were needed and if someone disagreed with your calculation you could also bonk them on the head with it.
All technologies, as I’ve written before, are a double-edged sword. It is important that we understand both in order to make technology do the stuff that actually makes our lives better.
As a society, we started to really get into data, primarily statistics, in the mid 17th century when John Graunt, a hat maker, had a rather morbid interest in collecting data regarding deaths in London. Hats off to him. It turned out to be a revolutionary idea that influenced how we use medical data to this day and he’s considered the father of demography. Arguably, he was the first person to use data analysis to understand and then solve a problem. That honour probably goes back to the Egyptians or Greeks.
We ought not to forget Florence Nightingale either, for if Graunt started the whole medical data and demography thing, Florence, in my view, and many others, was the mother of data visualisation. And data visualised, tells a much more interesting story, as anyone who’s combed through endless columns of a spreadsheet can attest. Thank-you Florence. Who doesn’t love a good infographic?
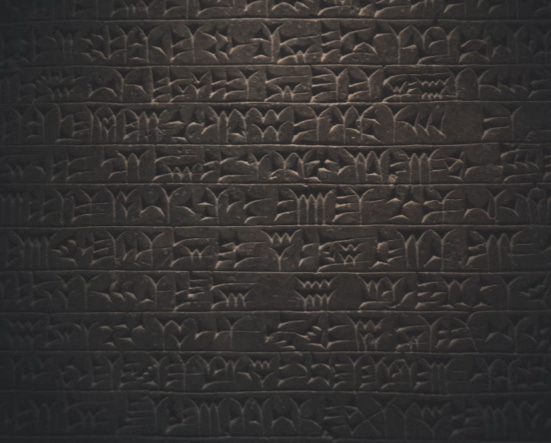
When writing became a thing a few thousand years ago, we didn’t start off writing love sonnets and poems. We started by collecting data. Egyptians were incredibly skilled at this through cuneiform on tablets. So if you don’t much like your accountant today, blame the ancient Egyptians.
Punch cards as a means of collecting data came along in the late 19th century thanks to Herman Hollerith, in the 1920’s, another German (they do seem to like data.) Fritz Pfleumer patented magnetic tape (also still used today in the 21str century because of it’s reliability.) Then along came a Brit, Edgar Codd, who came up with the idea of a relational database.
Today, we have far more data than we can realistically figure out what to do with in any sensible form. The marketing profession opened up the aged barrels of data wine well over a decade ago and has become quite thoroughly drunk on it. So much so that there are entire conferences where everyone natters on about it ad nauseam, replete with hashtags no doubt. And still argues over what metrics are actually measurable and meaningful.
Yet, despite all this data love in marketing, there is increasing reports of just how bad data is used in the ad side of things from The Drum, Scott Galloway and more.
We now have terms such as data lakes and if you have a very nice data speedboat, you can have a data lakehouse. While we aren’t there yet, but one can imagine a data ocean is next.
It has been estimated that we produce around 329 million terabytes of data a day. So about enough hard disk drives to go to them moon and back several times stacked up. Surprisingly little of this data is created by humans, no matter how many times we like something on Instagram or TikTok. Much of it is by machines talking to machines.
We even toss around the phrase that data is the new oil. It isn’t. Not just because oil is polluting, but because oil is finite. Data is not.
Data too, is raw. It becomes information when we do something with it. Like creating infographics or spreadsheets. Even books. Increasingly, data is being seen as something monetizable. This is called Infonomics as envisioned by Douglas Laney who literally wrote the book on it. Of which one of my copies is dogeared and the other is pristine and signed by Doug. Valuing data could add significant value to companies and be of use in other economic applications in the future.
Data becomes information and when we do something with information, it becomes knowledge. The more data we get, the more information we can create and ideally, more knowledge. As a species, we thirst for knowledge, perhaps more than anything else. Food and water may nourish our bodies, but data nourishes our minds. When we share it, when we use it to tell stories and come together, we evolve as a species.
If culture is the operating system of humanity, then data is the raw means that results in the stories we tell through culture. Arguably though, we are at a point when we may well have more data than we can really make sense of. This is where Artificial Intelligence may be a solution. Once it stops hallucinating. Then perhaps, we may truly grasp data and really make it work for our benefit in ways that benefit humanity.